

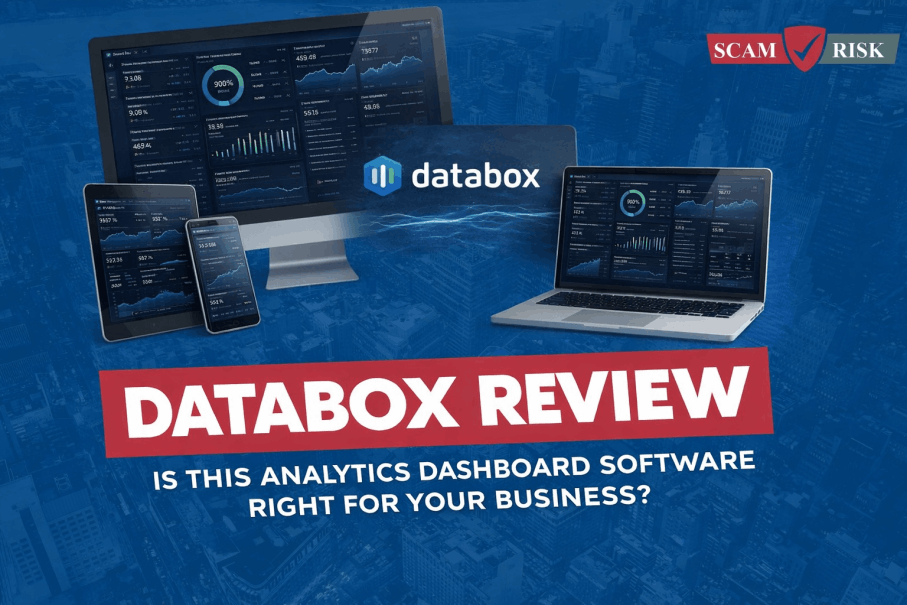
Why Databox Features Matter In 2026
Databox is easier to appreciate when you look at the way the official site organizes its product story. Even on the pricing pages, the product language keeps pulling you toward things like:
- Features.
- Problems we solve.
- Cloud integrations.
- Databases and warehouses.
- Spreadsheets and automations.
- Tools and templates.
That is a strong signal that Databox is not trying to be a single-dashboard novelty. It is trying to be a reporting and performance workspace that sits close to the messiest parts of modern data work.
If you want to inspect the product while you read, start with Databox here.
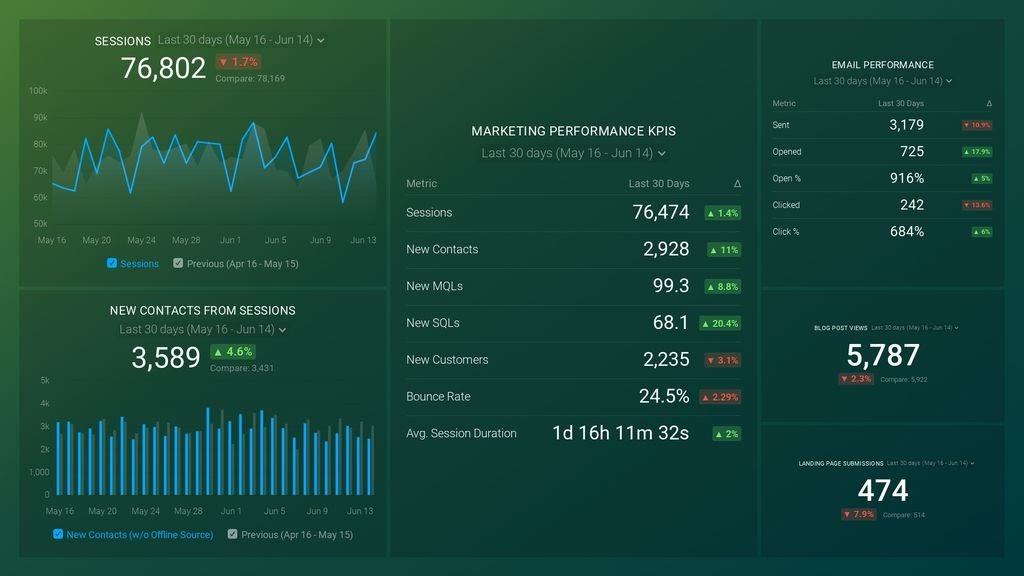
Feature #1: Broad Data Source Coverage
This is the first feature I would rank because it shapes everything else.
The official pages make a point of separating:
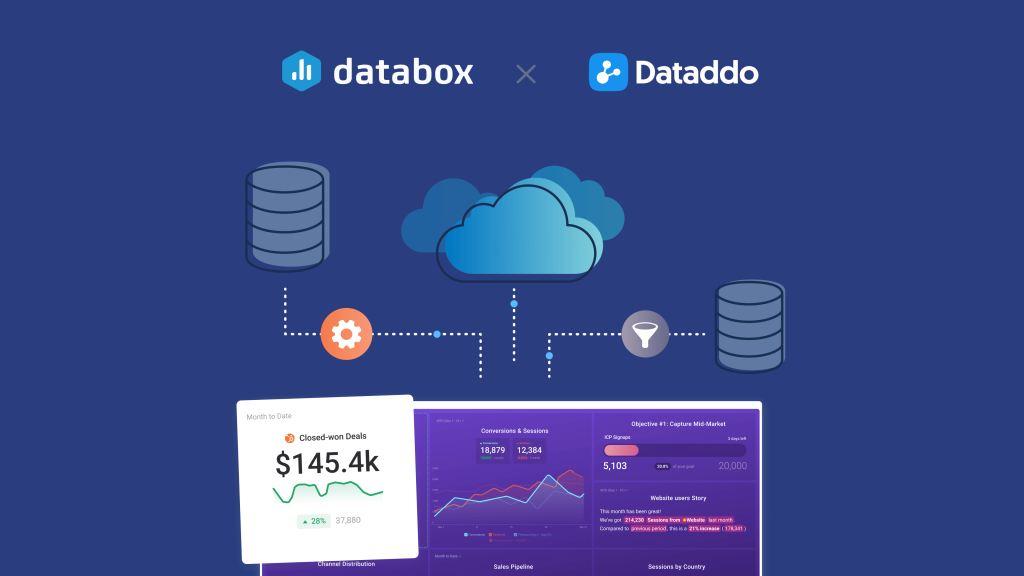
- Cloud integrations.
- Databases and warehouses.
- Spreadsheets and automations.
That matters because reporting software becomes much more valuable the moment it can pull from the places your team already works. If the data platform cannot connect cleanly, the dashboards do not matter very much.
For practical teams, this is one of Databox’s strongest value signals. It suggests the platform is built for mixed-source reporting environments rather than one neat channel with one neat dataset.
Feature #2: Problem-Solving Orientation Instead Of Generic Dashboard Hype
I like this one because it is subtle.
The official site does not only say “here are features.” It also says “Problems We Solve.” That sounds like normal marketing, but it matters because it frames the product around operational use rather than pure visualization.
That usually means the product is trying to answer buyer questions like:
- What do we track?
- Which teams need the numbers?
- How quickly can we see movement?
- How do we make reporting less manual?
For a busy marketing, sales, or operations team, that problem-first framing is often more useful than a long feature sheet full of shiny widgets.
Feature #3: Templates And Prebuilt Starting Points
The official pages also highlight tools and templates, which is a bigger deal than it looks.
One of the fastest ways to kill adoption in analytics software is to force every team to build every report from scratch. Templates are useful because they reduce the blank-page problem.
That helps Databox in three ways:
- New users get moving faster.
- Teams standardize more easily.
- Reporting becomes easier to repeat.
If your organization has ever said “we should build a dashboard” and then never finished it, this feature should matter more than it probably gets credit for.
If you want to see how that setup path is framed on the official side, review Databox here and look specifically at the way the platform groups templates, tools, and source connections.
[IMAGE: Databox templates and data source setup section]
Feature #4: Free-To-Start Positioning
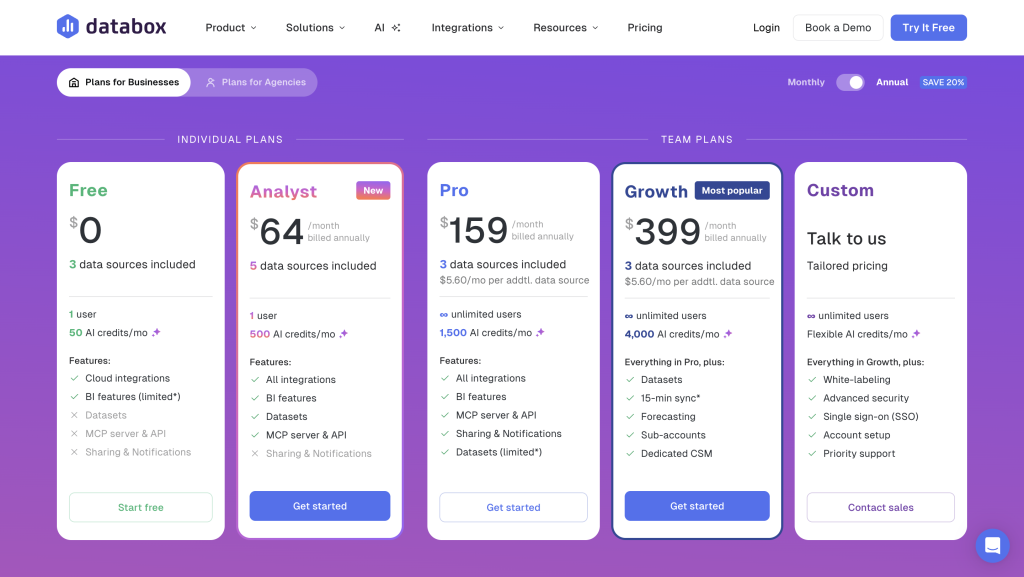
The pricing page includes the line “Free to start, built to scale,” and that is one of the more important feature-adjacent signals on the whole page.
Why?
Because a reporting platform often wins or loses during the adoption stage. If the first step is too heavy, teams delay it. If the first step is accessible, teams are more likely to test real workflows and discover whether the platform deserves a deeper rollout.
I am listing this as a feature because in modern SaaS, the ability to start without operational drama is part of the product experience.
Feature #5: Scale Beyond Spreadsheet Chaos
The official structure around spreadsheets, automations, databases, and integrations suggests that Databox understands a common company transition:
Teams begin in spreadsheets. Then spreadsheets get messy. Then the business needs a clearer reporting layer.
That transition is exactly where Databox looks strongest.
It is not pitching itself as a warehouse replacement. It is pitching itself as a better way to turn scattered source data into visible performance information without requiring every team to live inside raw tables all day.
That is a meaningful product capability, especially for growth teams, agencies, and revenue teams juggling too many sources at once.
Feature #6: A Product Story Built Around Adoption
This is an underrated strength.
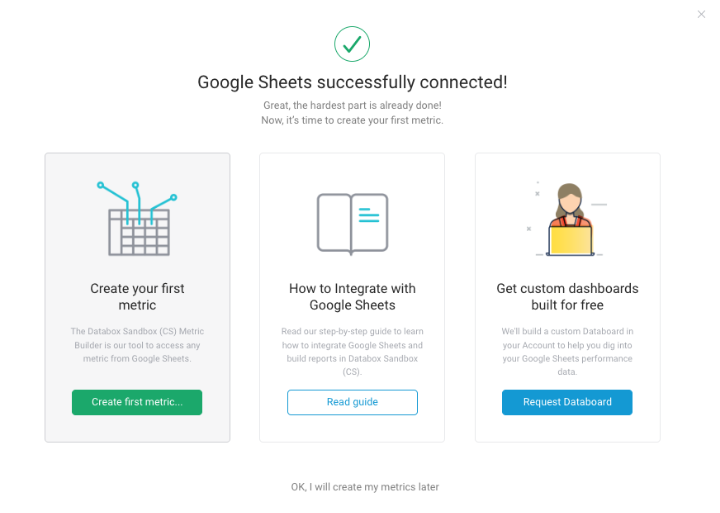
Some analytics tools feel like they were built for specialists first and normal operating teams second. Databox does not read that way on the public pages. The language around free trials, tools, templates, and problems solved suggests the product wants adoption to happen faster and with less friction.
That is a real feature because the best reporting platform in the world is useless if the team never gets past setup inertia.
For many buyers, a product that is easier to adopt, easier to explain internally, and easier to repeat across teams will beat a theoretically stronger but harder-to-launch competitor.
Features Coming Soon Or Worth Watching
I am staying careful here and not inventing roadmap promises. But based on the official page structure, the areas I would watch most closely over time are:
- Deeper integration breadth.
- Better automation between sources.
- More refined templates.
- Stronger workflow support around reporting problems rather than only dashboard output.
Those are the directions that would naturally strengthen the product identity already visible on the site.
What Makes Databox Different
The thing that makes Databox different is not just that it has dashboards.
Plenty of tools have dashboards.
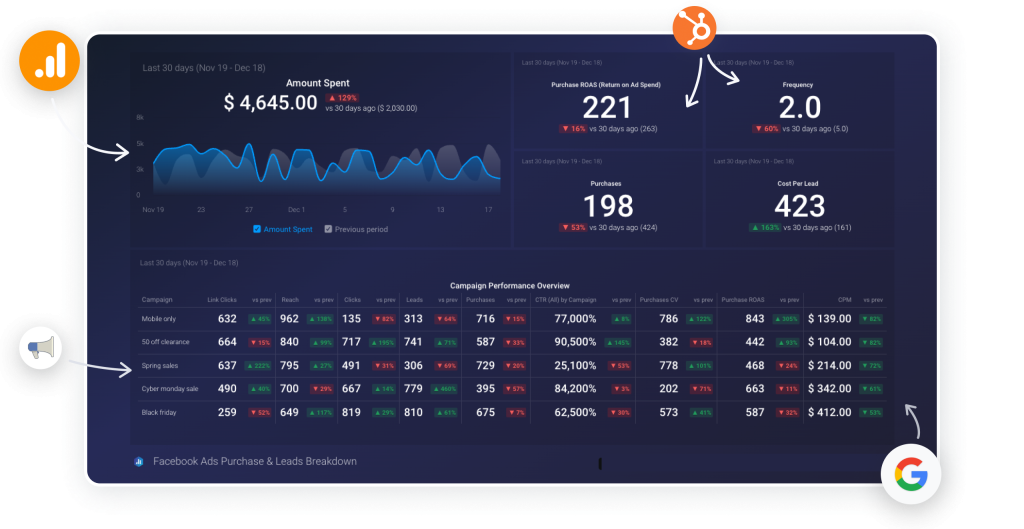
The difference is the official product framing around data-source variety, business problems, templates, and scaling out of spreadsheet-heavy reporting habits. That combination makes the product feel more practical than tools that only sell pretty charts.
For many teams, the real win is not beauty. It is consistency.
If you want to test whether the product feels practical enough for your team, open Databox here and compare its workflow shape against the reporting process you already use.
[IMAGE: Databox integrations, reporting, and team workflow view]
Which Feature Matters Most By Team Type
For Marketing Teams
The most important feature is probably source coverage. Marketing data is rarely in one place, and Databox looks strongest when it helps unify fragmented reporting inputs.
For Agencies
Templates matter a lot. Agencies benefit when reporting can be repeated, standardized, and launched quickly across clients.
For Revenue Or Operations Teams
The problem-solving orientation matters more than style. Teams need reporting that reduces manual compilation and speeds up decision-making, not just prettier slides.
For Smaller Businesses
The free-to-start signal matters most. Adoption happens faster when the first step is easy to justify and test.
What The Best Databox Features Add Up To
The reason these features matter together is that they reduce reporting drag from several directions at once.
Databox is not only saying, “We have integrations.”
It is also saying:
- We understand spreadsheet overload.
- We understand reporting setup friction.
- We understand teams need templates, not only theory.
- We understand adoption matters before scale does.
That combination is why the feature set feels practical. It is designed to get a team from messy reporting habits to a more structured performance workflow without requiring a giant analytics rebuild on day one.
Final Ranking
If I had to rank Databox’s best features in 2026, I would do it like this:
- Broad data source coverage.
- Problem-solving product framing.
- Templates and prebuilt starting points.
- Free-to-start, built-to-scale onboarding path.
- Strong fit for teams graduating from spreadsheet chaos.
That list captures what makes Databox compelling in actual work, not just in product marketing.
FAQ
What Is Databox Best Known For?
Databox is best known for turning reporting inputs from multiple sources into a more visible and repeatable performance workflow.
Does Databox Only Work With Cloud Apps?
No. The official pages also reference databases, warehouses, spreadsheets, and automations.
Why Are Templates Important In Databox?
Templates reduce setup friction and make it easier for teams to standardize recurring reports without rebuilding everything from scratch.
Is Databox Good For Small Teams?
Yes, especially because the official pricing message includes “Free to start, built to scale,” which lowers the barrier to testing the platform.
What Makes Databox Different From Generic Dashboard Tools?
Its official positioning is more grounded in source coverage, practical reporting problems, and repeatable team workflows rather than in dashboard aesthetics alone.
Verdict
Databox’s top features in 2026 are not flashy for the sake of being flashy. They are useful because they map directly to the real reporting problems teams have:
- Too many data sources.
- Too much spreadsheet sprawl.
- Too much manual reporting.
- Too little repeatability.
That is where the platform looks strongest.
If that sounds like your environment, try Databox here and judge the product against your current reporting friction instead of against a generic dashboard feature list.